Welcome to Milan Urban Dynamics

This interactive platform presents groundbreaking research on income segregation patterns in Milan, Italy. Our study uses high-resolution location data to reveal how social mixing changes throughout the day across diverse neighborhoods.

By examining these dynamics, we provide insights into how urban design impacts socioeconomic integration.

Understanding the Income Triade

Our innovative approach uses a three-dimensional "income triade" framework to visualize social mixing among high, medium, and low-income groups.

This method reveals not only the extent of segregation but also its specific composition across the urban landscape.

Income Triade Part 1 Income Triade Part 2

How to Use This Platform

Explore the Interactive Map: Click on any hexagon to view detailed income trajectory data for that neighborhood over 24 hours.

Compare Patterns: Observe variations between weekdays and weekends.

Understand Urban Factors: Discover how features such as public transport and amenities influence segregation patterns.

Time-space dynamics of income segregation in Milan

Exploring how social mixing patterns change across neighborhoods and time in one of Italy's most vibrant cities through high-resolution location data

Learn More

About the Study

Uncovering the dynamic patterns of social mixing in urban spaces

Traditional approaches to urban income segregation focus on static residential patterns, missing the complex rhythms of how different socioeconomic groups interact throughout the day. Our research breaks new ground by analyzing high-resolution location data from 94,000 mobile phone users in Milan over a ten-month period.

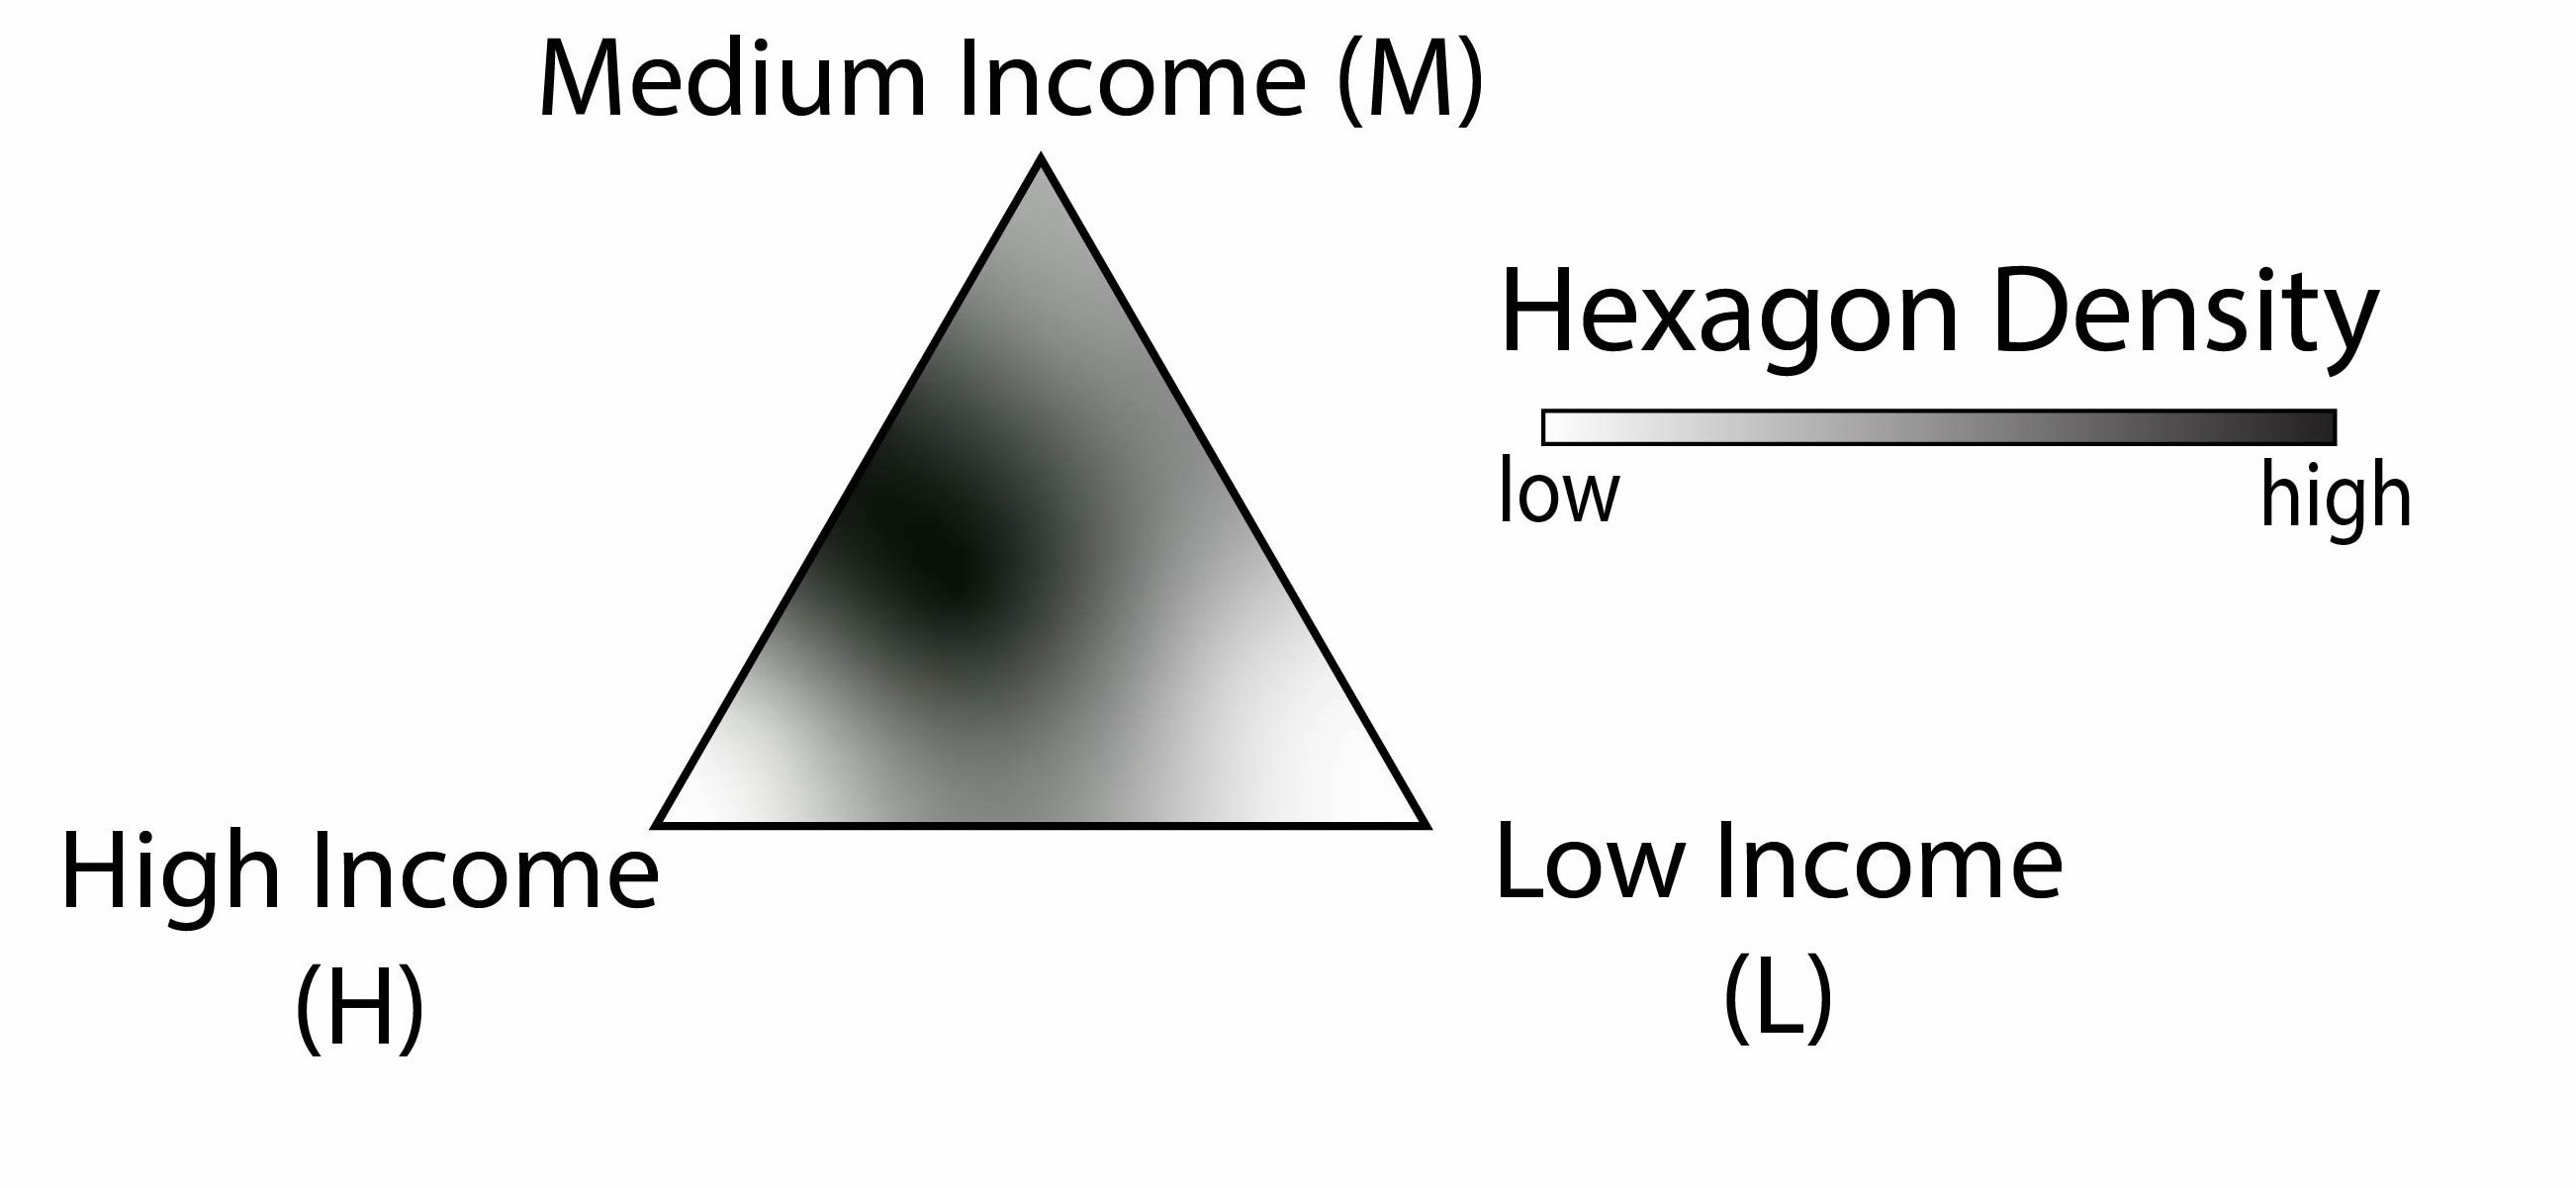
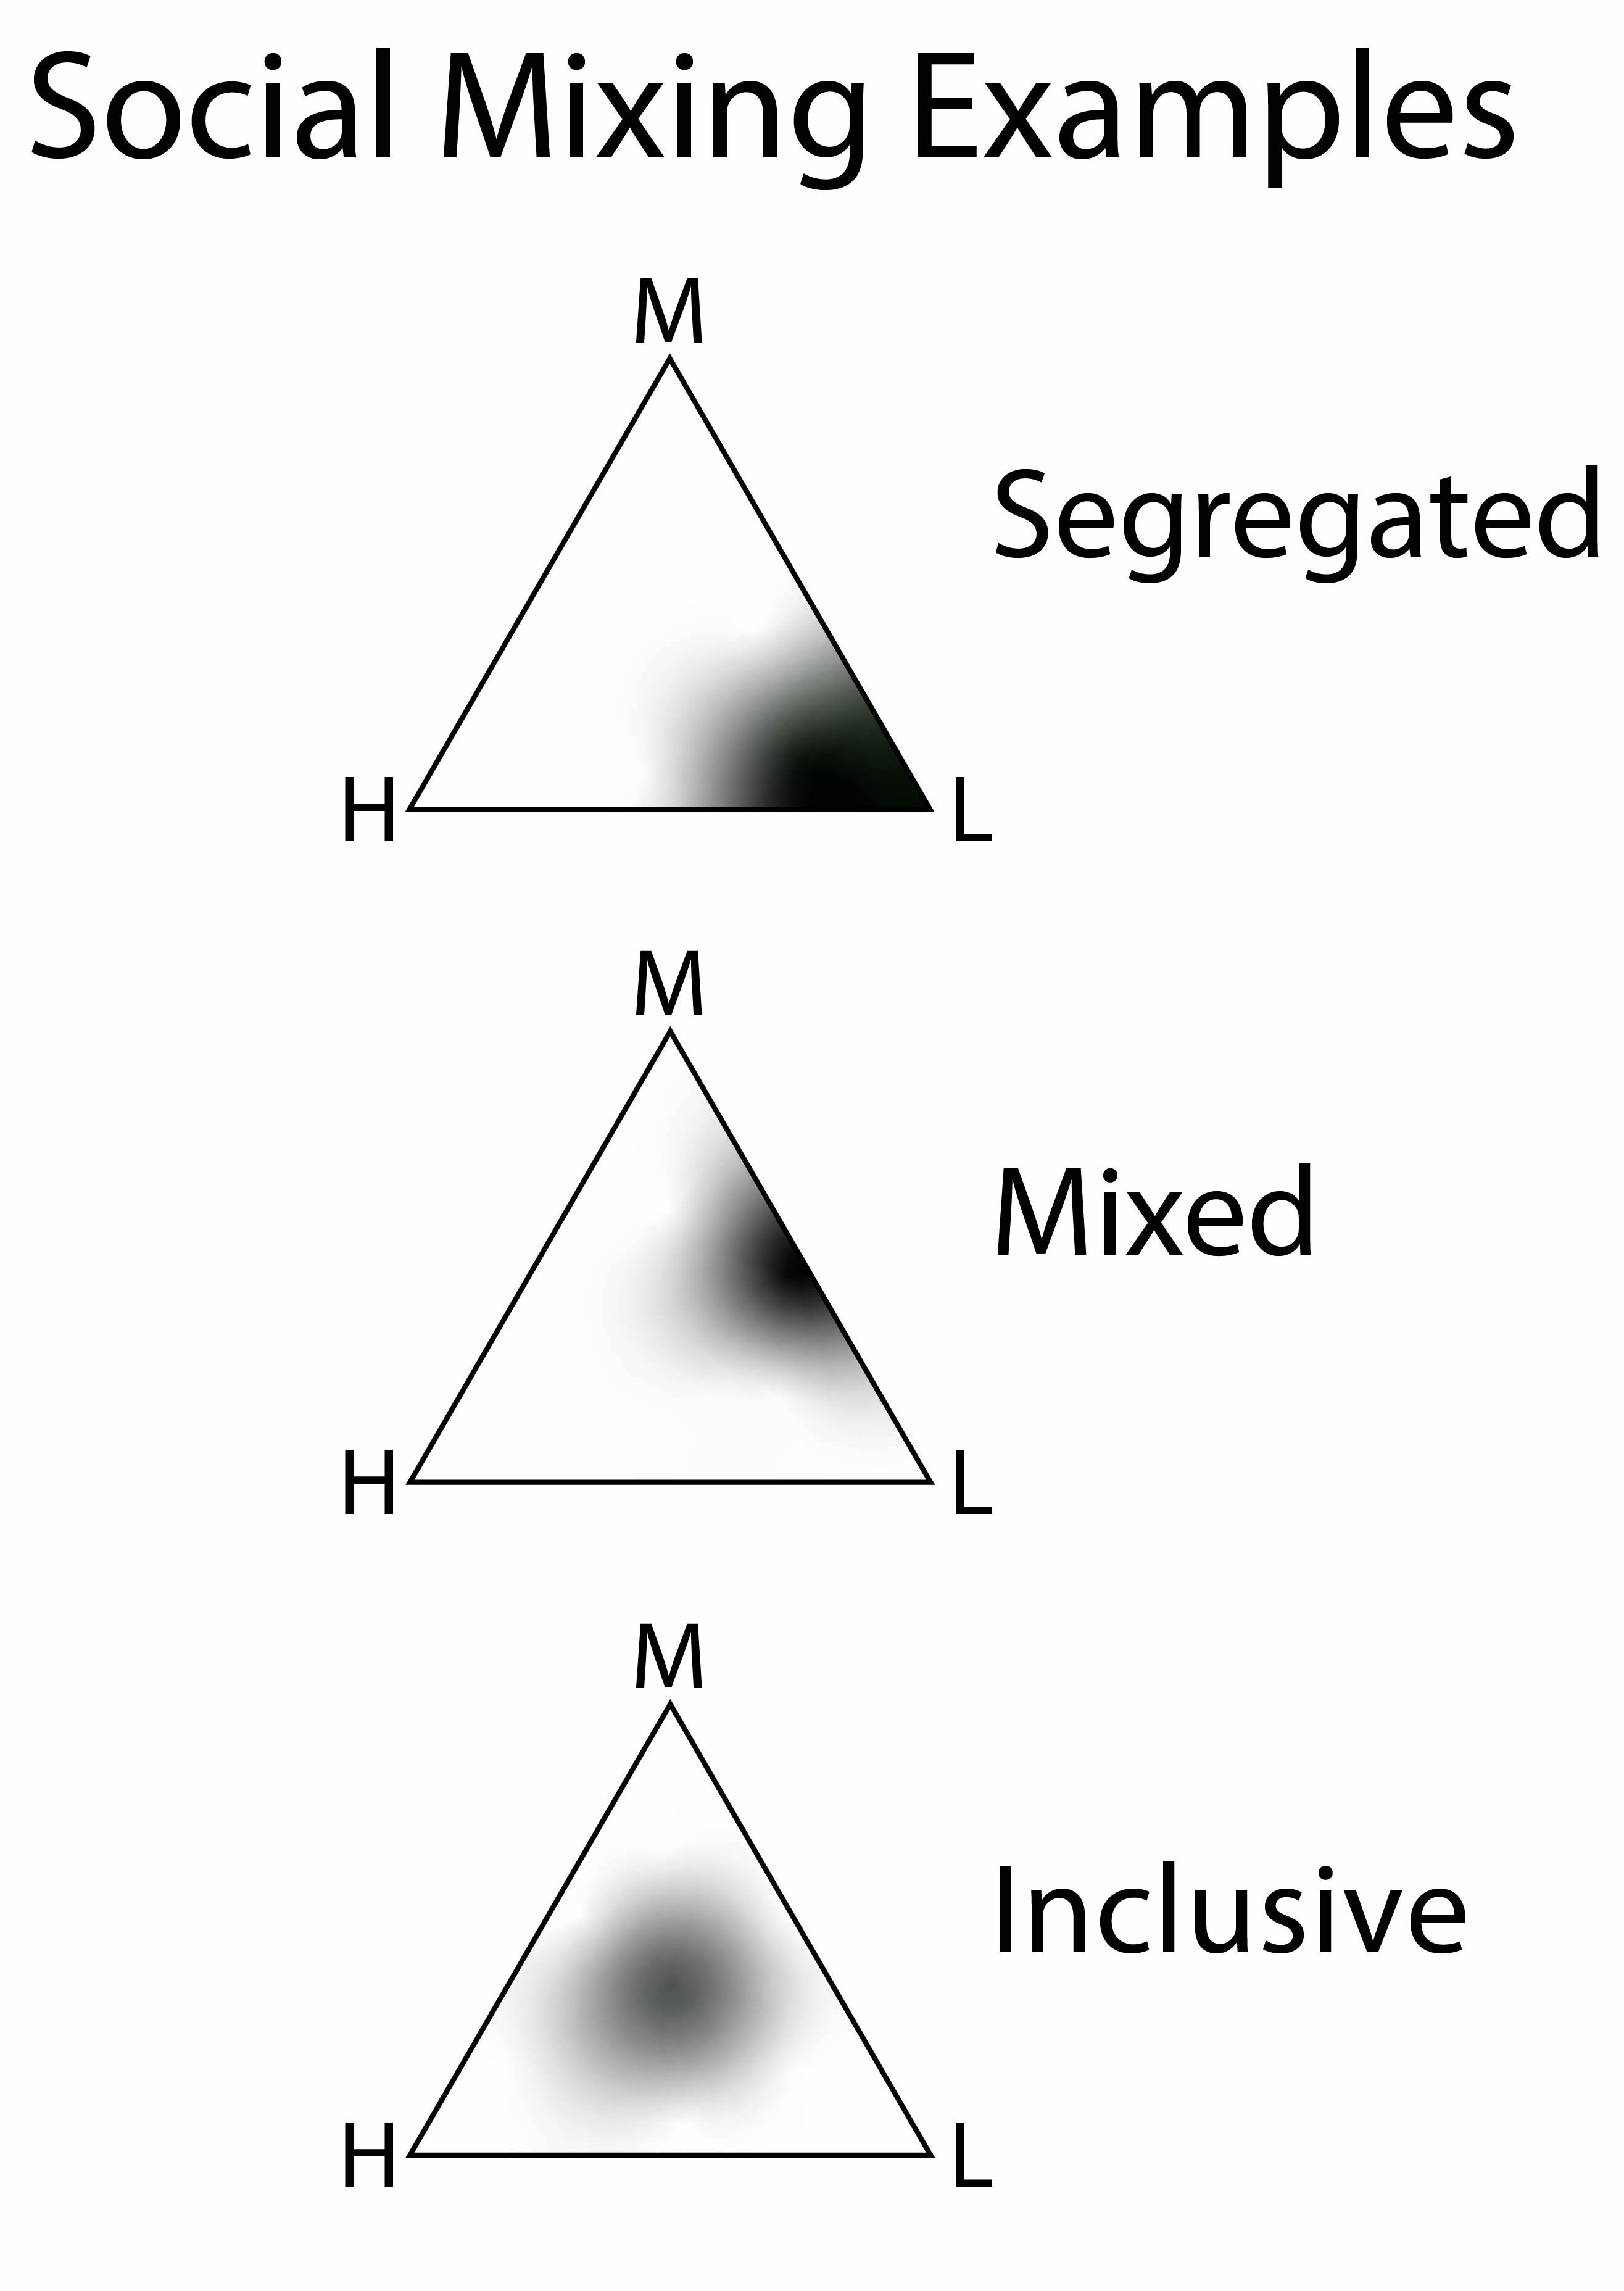
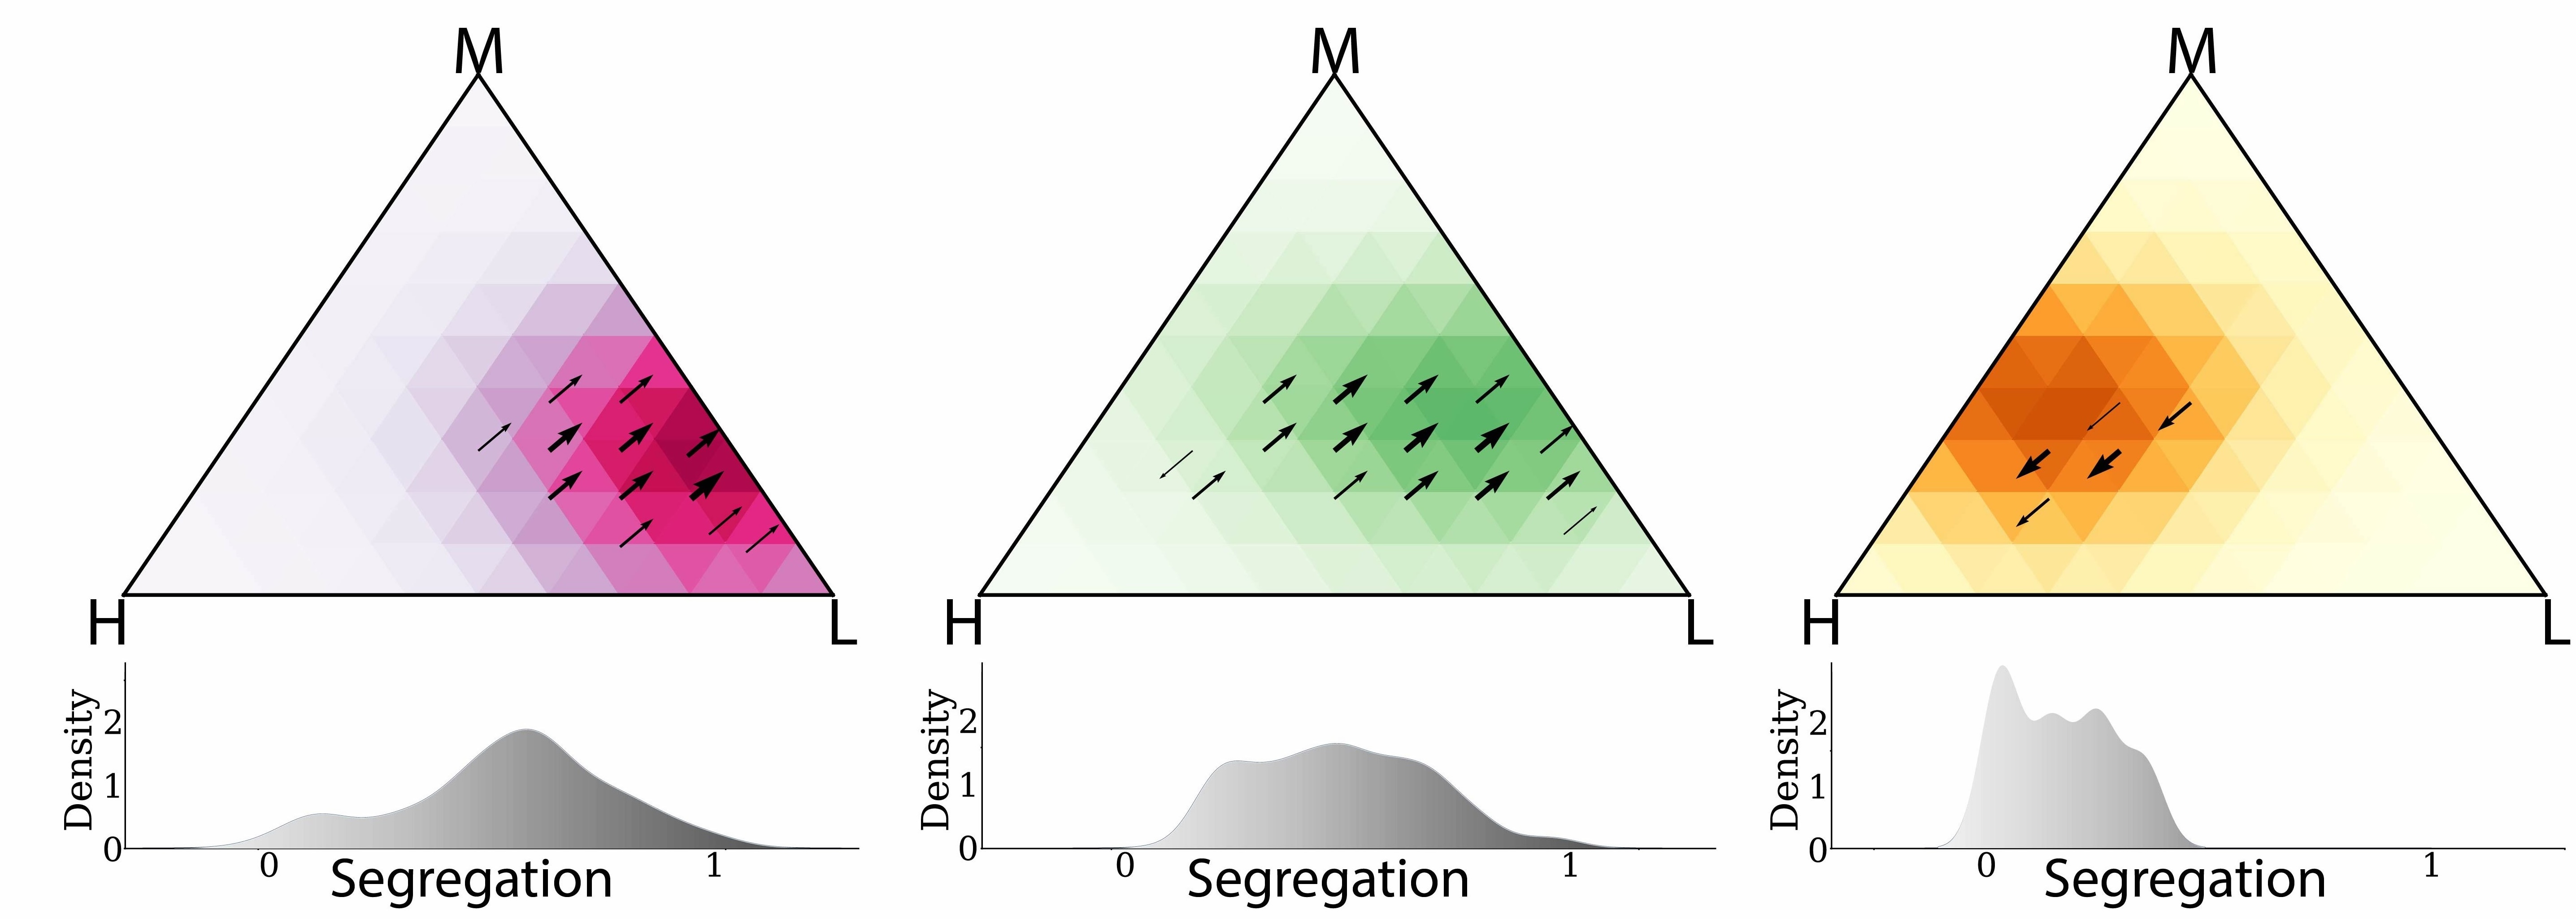
Key innovation: The three income groups define a novel three-dimensional space embedded in the temporal dynamics of urban activities, which we propose as a framework to analyse social mixing.

By tracking mobility patterns of high, medium, and low-income residents, we've discovered that Milan's social landscape transforms dramatically as people move through the city for work and leisure activities.

Key Research Findings

  • Dual personality neighborhoods — High-quality central areas that are inclusive during work hours but exclusive during leisure time
  • Hidden transition zones — Medium-quality neighborhoods that unexpectedly bridge socioeconomic divides
  • Key drivers of inclusion — Public transportation, amenity diversity, and price diversity foster social mixing

This research offers crucial insights for urban planners and policymakers seeking to create more inclusive cities through evidence-based design interventions that can reduce socioeconomic divides.

Our Methodology

We analyze high-resolution mobility data from 100,000 users in Milan to capture the real-time dynamics of income mixing across the city.

Location Data

Ten months of anonymized data tracking home, work, and third-place activities.

Income Proxy

Rental prices near residences provide estimates of income levels.

ALA Clustering

300m hexagons categorized by Accessibility, Liveability, and Attractivity metrics.

How Segregation Changes Throughout the Day

Residential Segregation

Nighttime Segregation Patterns

During nighttime, we observe high levels of segregation as people remain at home. This reveals the underlying residential divisions in Milan:

  • Low-ALA (pink) neighborhoods are primarily inhabited by low-income residents
  • Medium-ALA (green) areas house mainly low and medium-income groups
  • High-ALA (yellow) central areas are dominated by high and medium-income residents

The histograms below each triangle show segregation levels measured by the Gini coefficient, with values closer to 1 indicating higher segregation.

This residential pattern forms the baseline from which daily mobility will temporarily alter the segregation landscape during other time periods.

Workplace Integration

Work Hour Segregation Patterns

During work hours, segregation decreases dramatically as people commute to different parts of the city. Central areas become hubs for cross-income interactions:

  • High-ALA neighborhoods transform into more inclusive spaces
  • The city center emerges as a crucial space for interaction

Work environments serve as temporary bridges connecting different socioeconomic groups.

Our research reveals that high-ALA neighborhoods exhibit 'dual functionality' - they become highly inclusive during working hours but often revert to higher levels of segregation during leisure periods. This pattern underscores how urban spaces can serve different social roles throughout the day.

Evening Leisure Activities

Evening Leisure Segregation Patterns

During evening leisure hours, voluntary mixing patterns emerge. We observe distinct patterns across neighborhood types:

  • High-ALA areas maintain some mixing but begin shifting back toward segregation
  • Medium-ALA areas form a 'ring-like pattern' around the city center and display greater inclusivity through pairwise mixing among adjacent income groups
  • Low-ALA neighborhoods strongly revert to segregation

This phase highlights how free-time choices and urban amenities influence social integration.

Notably, medium-ALA neighborhoods with greater price diversity function as important 'transition zones' that maintain higher inclusivity during evening hours than might be expected from their infrastructure quality alone. This challenges conventional urban planning assumptions that focus primarily on high-end central development.

Interactive Map Exploration

Click on any hexagon to view detailed income trajectory data and explore neighborhood dynamics.

Note: The interactive map focuses specifically on third places (leisure and social activity locations), allowing you to explore how income mixing changes during stops made not at home or work.

About This Study

This interactive map visualizes income segregation patterns in Milan, Italy. The hexagons represent neighborhoods classified by their Accessibility, Liveability, and Attractivity (ALA) metrics.

Understanding the Income Triade

When you click on a hexagon, you'll see a triangular plot called the "income triade." This visualization shows:

  • Each corner of the triangle represents an income group (high, medium, low)
  • The position of points within the triangle shows the mix of income groups in that neighborhood
  • Points near corners indicate dominance by one income group (segregation)
  • Points in the center show equal representation of all groups (inclusion)
  • The animation shows how this mix changes over 24 hours

How to Use This Map

Click on any hexagon to explore detailed income trajectory data for weekdays and weekends. The colors indicate the quality of neighborhoods:

  • Pink: Low ALA cluster
  • Green: Medium ALA cluster
  • Yellow: High ALA cluster

Research Background

This study analyzes how income segregation patterns vary throughout the day in Milan. We use Location-Based Services data from approximately 100,000 users and examine the interplay between neighborhood characteristics and social mixing.

About the Research

Research Statement

This research uses high-resolution location data from mobile phones to reveal how social mixing patterns change throughout the day across Milan's diverse neighborhoods. By examining the spatial and temporal dynamics of income segregation, we provide insights into how urban design and neighborhood characteristics influence socioeconomic integration.

Publication

  • Rossi Mori, L., Loreto, V., & Di Clemente, R. (2025). Time-space dynamics of income segregation in the city of Milan. Under Review PNAS Nexus. DOI:10.48550/arXiv.2309.17294

Data Visualization

Funders

Team

Supervision

Research

Contact

Partner Institutions