Covid-19 UK Mobility Project
This is the collection of the output of the Study group on UK-mobilty during the COVID-19 Pandemic.
It includes two reports and one final paper.
See here the Data visualization of the main results.
First Report: Analysis of human mobility in the UK during the COVID-19 pandemic
(09 Apr. 2020)

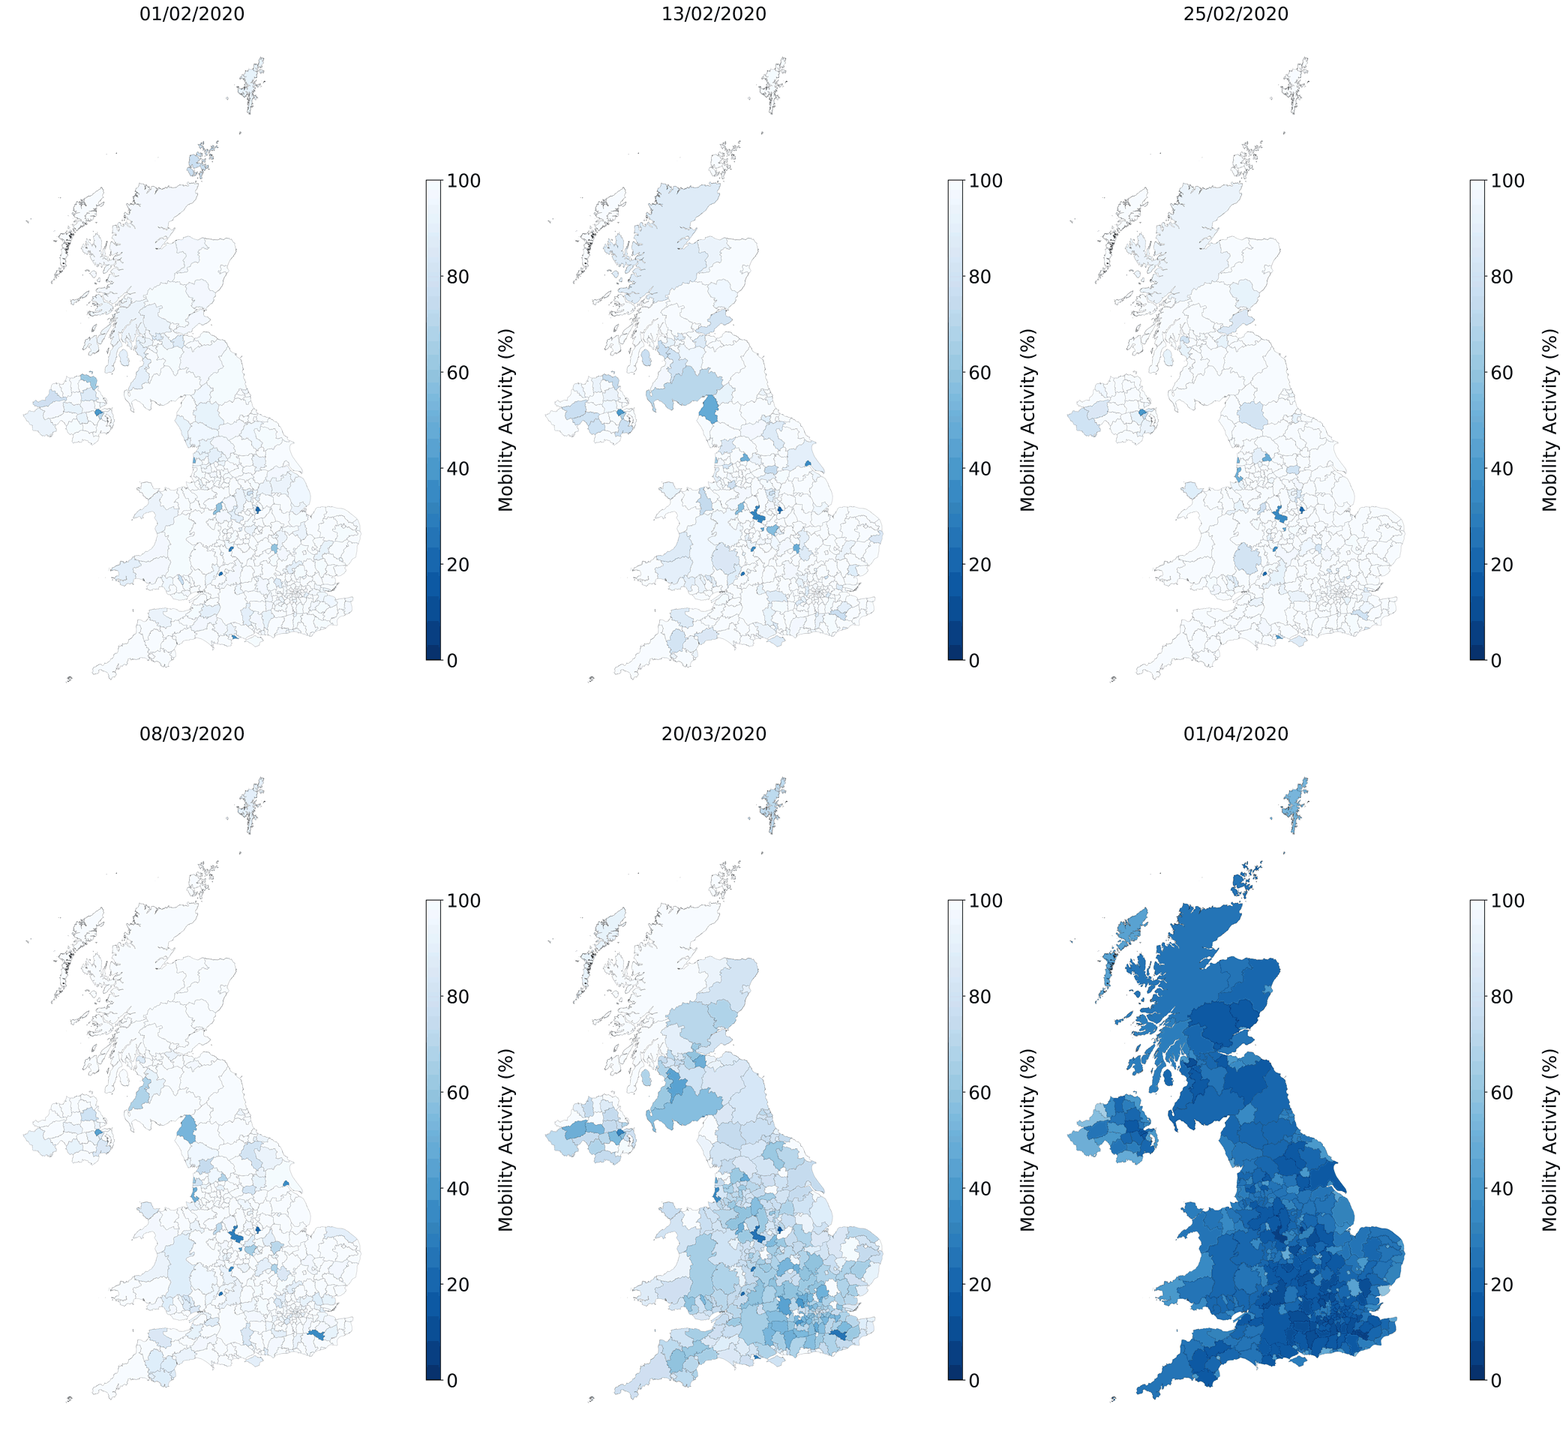
Our aim is to assess the effects of the COVID-19 restriction measures on the mobility patterns of people in the UK. These measures are strong public health policies which came into place as a consequence of the COVID-19 pandemic and its potential impact on the British population and on the NHS. To do so, we analyse changes in the average levels of mobility of anonymous mobile phone users across the country at different time periods, which include the periods when the restriction measures are in place and enforced by authorities.
Main Results
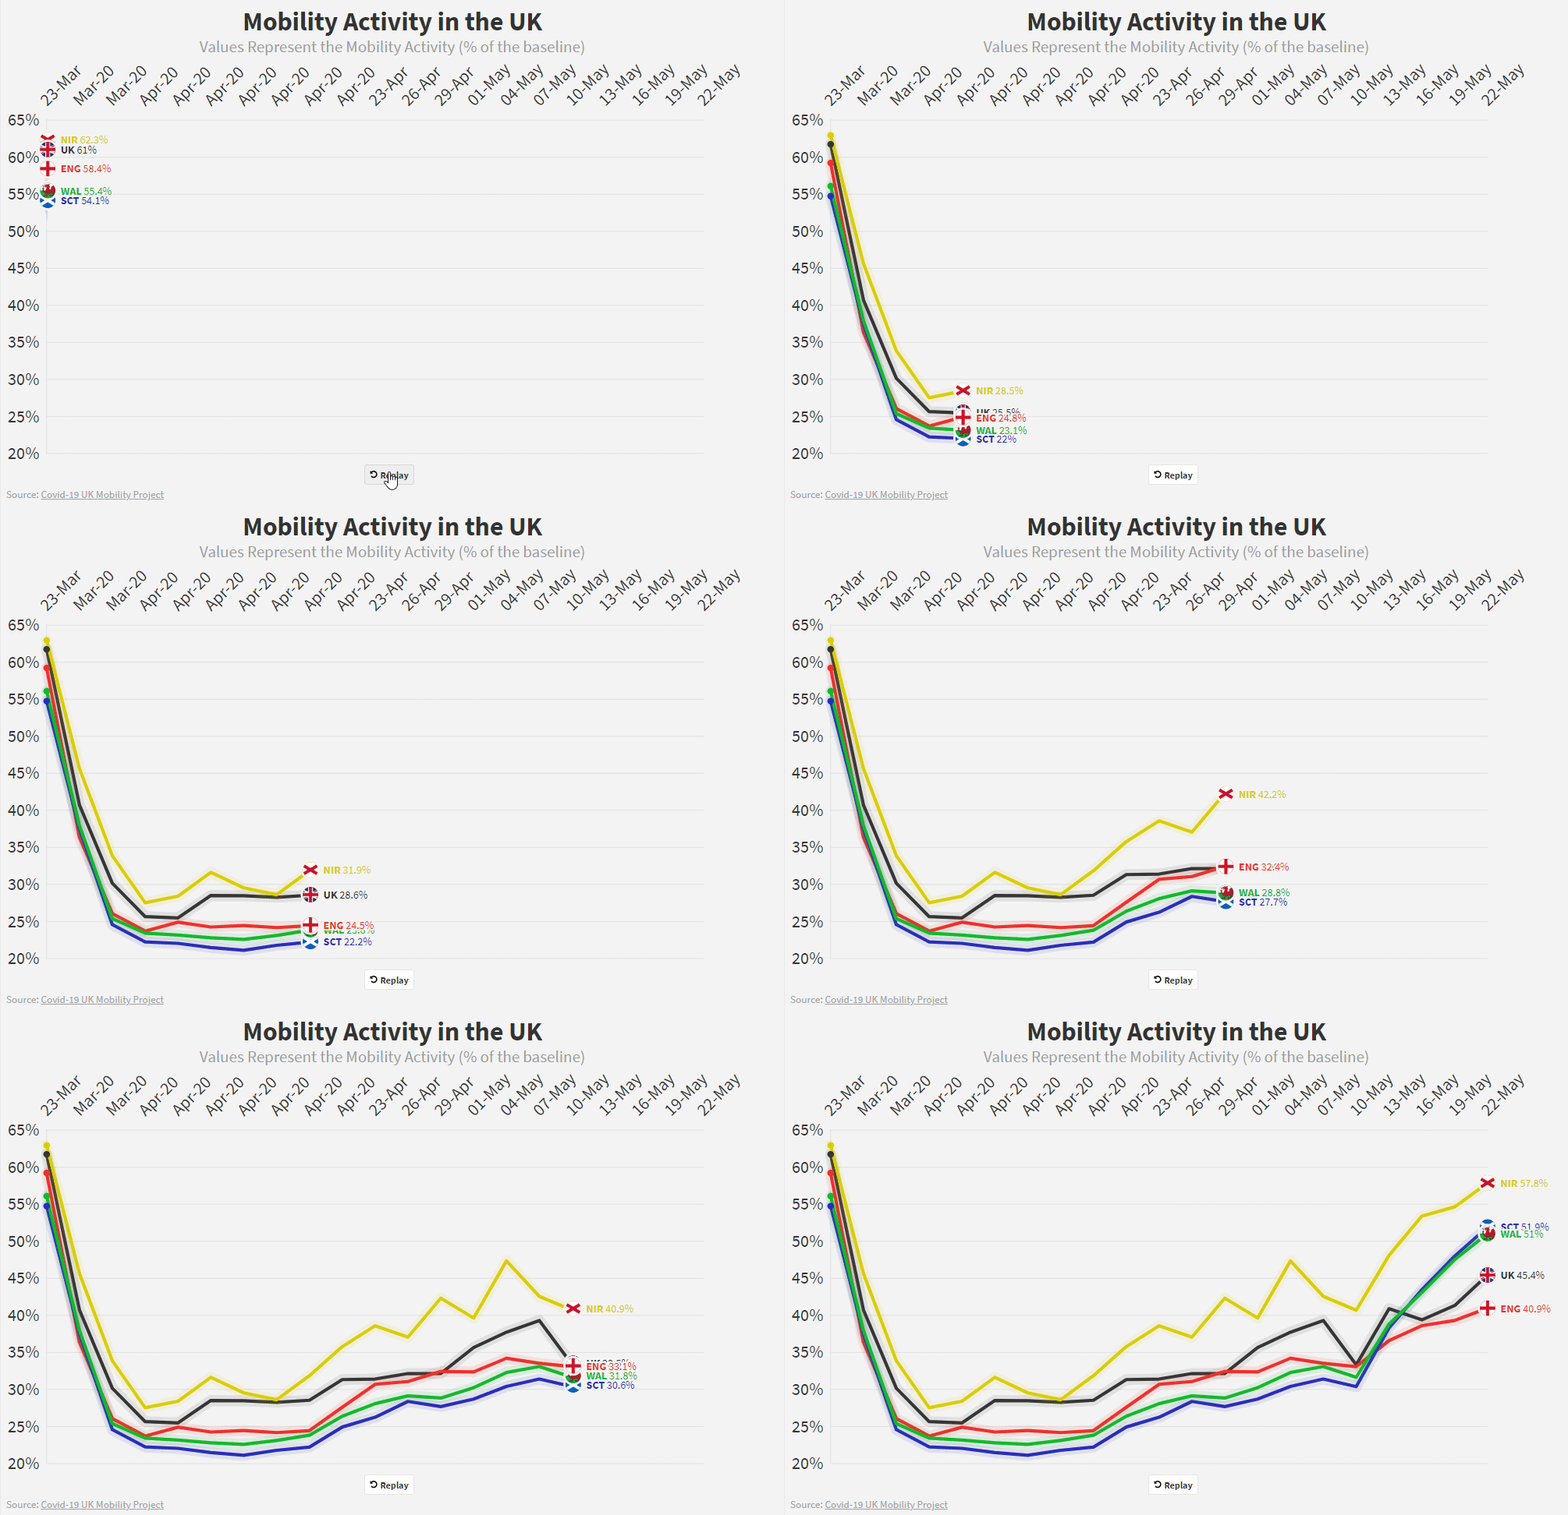
In early March, before restriction measures were enforced, mobility levels decreased by about 10% compared to their normal levels before the pandemic.In the middle of March, after people were encouraged to work from home and reduce their travelling, mobility levels dropped by about 50% compared to before the pandemic.
From March 24th onwards the UK entered a state of lockdown, with only essential travelling allowed. This led to a reduction of about 70% in the mobility levels.
Mobility levels have dropped consistently in all areas across the UK after the lockdown measurements.
These results present our initial analysis of the restriction measures and their effect on mobility across the UK. This might be of interest to epidemiologist who can use this to estimate contact matrices, and to public health policy makers who have to assess the impact of their policies on the British population.
Second Report: Analysis of socioeconomic aspects related to mobility patterns in the UK during the COVID-19 pandemic
(04 Jun. 2020)

Lockdown measures put in place around the world have affected people's lives at various levels. The debate about when they should start and end is endless, with many defending variations of it which consider age, health risk, and the importance of labor for society (key workers), to name a few.
In certain locations in the world, particularly in developing nations, the debate is between health issues (lockdown) vs. survivability (getting back to work); this debate is around health concerns and the economy and it is hard to delve into. In line with the worries about the economy, a few world leaders have defended what is called vertical social isolation to "enable people in low-income classes to earn a living" and "avoid further suffering from loss of income".
Although these policies have not been in place in the UK we explore what has been the \textit{de facto} effect of lockdown policies on different social classes in several regions of the UK.
In addition to the regional differences, we also investigated how the mobility restriction measures and the partial lockdown affected the mobility patterns of populations from different socioeconomic groups according to the Office of National Statistics Socio-economic Classification (SEC).
Paper: Changes in the time-space dimension of human mobility during the COVID-19 pandemic
(19 Jan. 2022)

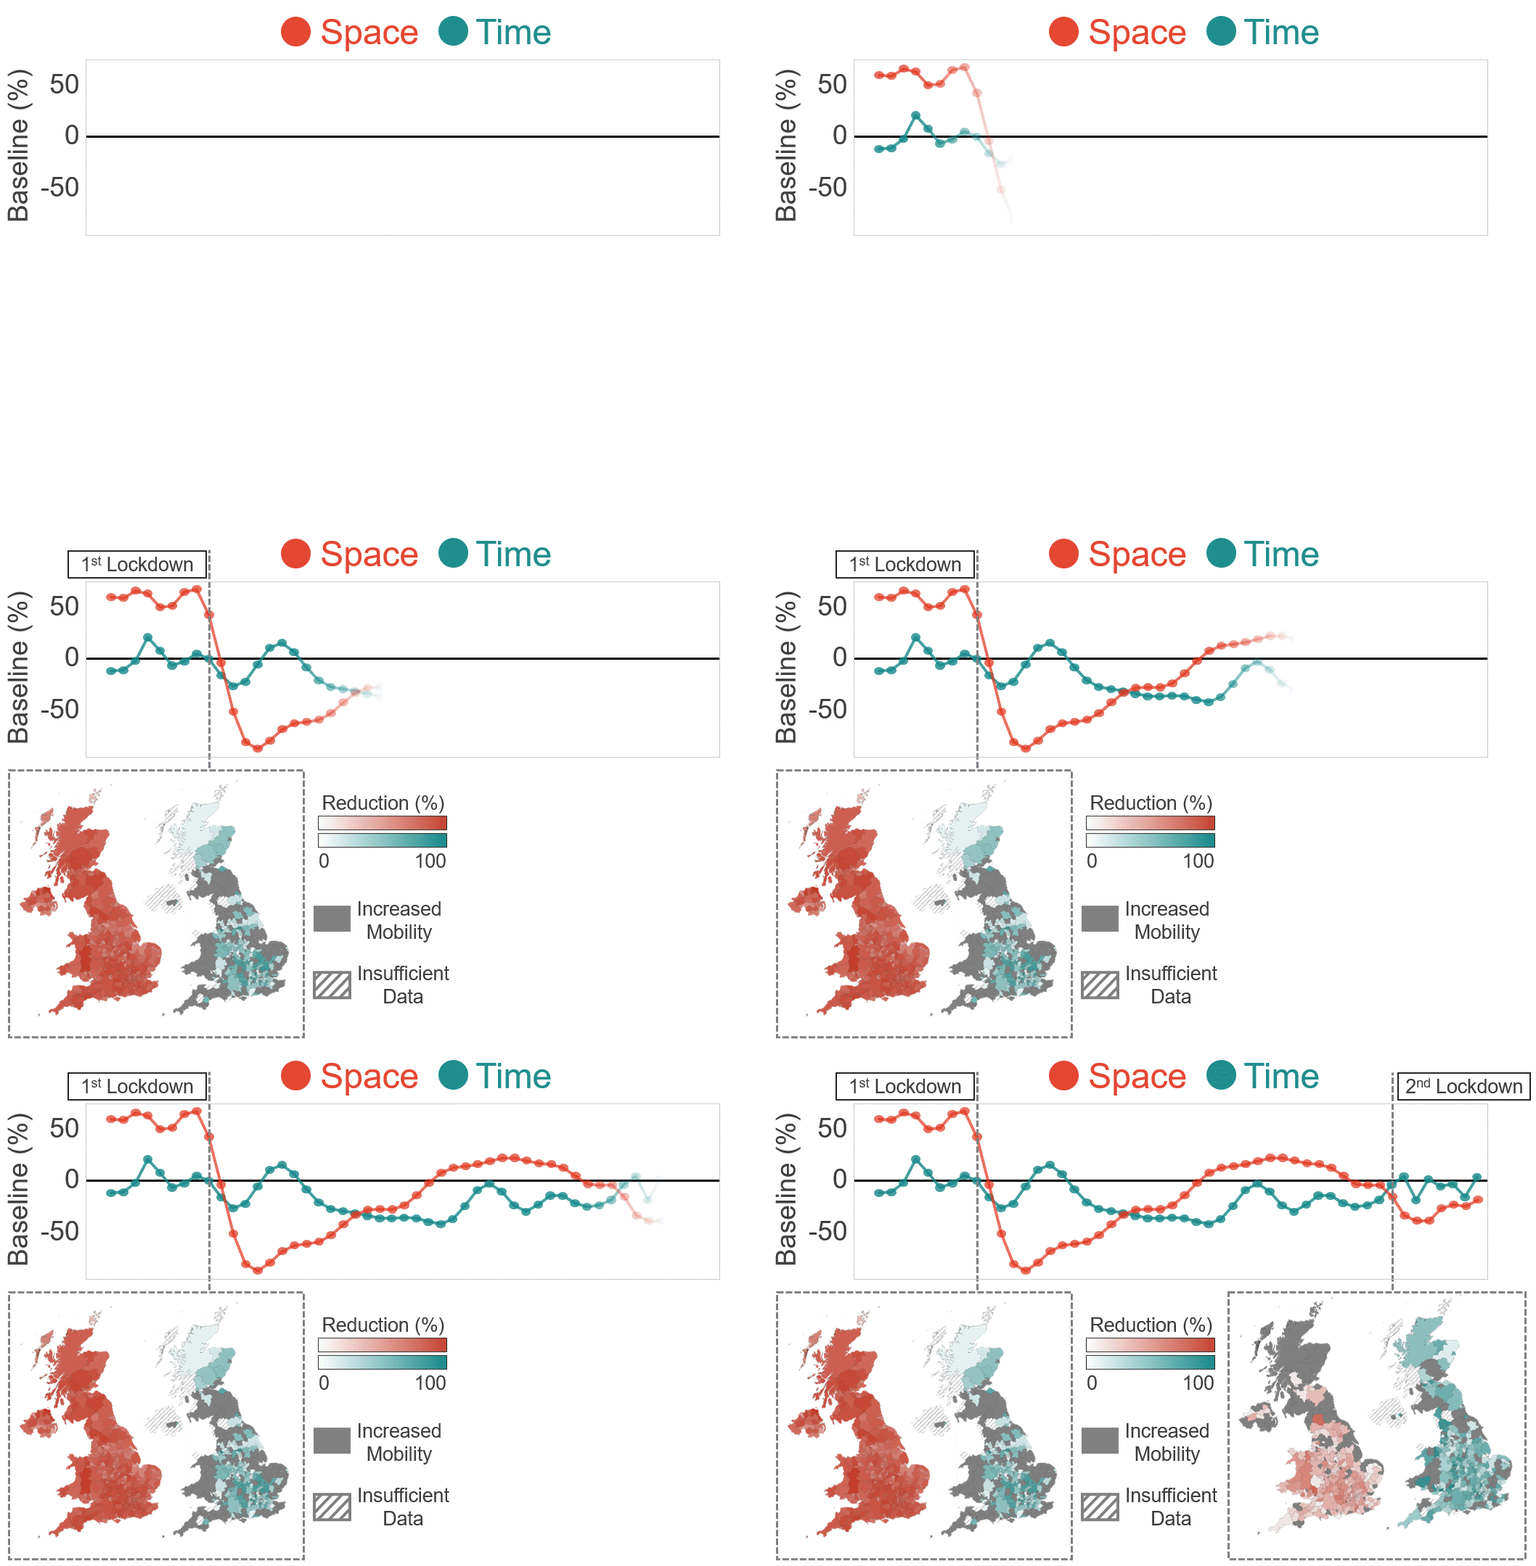
Socio-economic constructs and urban topology are crucial drivers of human mobility patterns. During the COVID-19 pandemic, these patterns were re-shaped in their main two components: the spatial dimension represented by the daily traveled distance, and the temporal dimension expressed as the synchronization time of commuting routines.
Leveraging location-based data from de-identified mobile phone users, we observed that during lockdown restrictions, the decrease of spatial mobility is interwoven with the emergence of asynchronous mobility dynamics.
The lifting of restrictions in urban mobility allowed a faster recovery of the spatial dimension compared to the temporal one. Moreover, the recovery in mobility was different depending on urbanization levels and economic stratification.
In rural and low-income areas, the spatial mobility dimension suffered a more significant disruption when compared to urbanized and high-income areas.
In contrast, the temporal dimension was more affected in urbanized and high-income areas than in rural and low-income areas.
Paper: Economic complexity and Covid-19 outcomes in UK local authorities
(10 Feb. 2022)
COVID-19 outcomes differ according to socio-economic indicators. In this study, we find there is a specific structure to the differences among UK local authorities, as localities with a lower economic complexity index (ECI) registered significantly higher COVID-19 cases and deaths.
We show that the ECI is a predictor of people’s movements, with mobility declining in high ECI localities during the pandemic, but not in low ECI places where a higher proportion of people have high-risk jobs more likely to lead to virus transmission. Local economic structures shape people’s pandemic experiences and this calls for strategies to reduce spatial inequalities.